Showing posts with label #elitestuff. Show all posts

Friday, March 27, 2015

Higher Education Enrollment and Graduation Rate: Initial Thoughts

One of my research interests is higher education enrollment. What I mean by this is how many students are enrolled at the many different types of higher education institutions in the United States . This interest stems from my job where the vast majority of students who attend the university I work and teach at are students with many risk factors that contribute to the difficult task of completing a traditional 120 credit undergraduate degree within four to six years. I also taught at community colleges in Arizona where the student demographic has a similar student profile.

Institutions who educate at-risk students are often harshly criticized in the higher education community for poor graduation rates while other institutions are lauded for high graduation rates. Articles at The Chronicle and Inside Higher Education seem to reflect an inherent bias towards associates education and focuses on higher performing undergraduate and graduate institutions, faculty, and students. In this article I will merely present data about higher education enrollments as I work on where to take my initial thoughts and observations.  

Higher Education Enrollment Data:
Using the IPEDS Data Center I downloaded data for all higher education institutions in North America for the academic year 2013 (the most recent available). There are dozens and dozens of reports you can create using IPEDS and for this initial investigation I downloaded: total enrollment, undergraduate enrollment, graduate enrollment, 4, 5, and 6-year undergraduate graduation rate, and the 2010 Basic Carnegie Classification for all institutions.

There are a lot of higher education institutions in the United States. There are 7,764 institutions with a total enrollment of 22,180,669; 18,233,606 undergraduate and 2,947,063 graduate students.

First observation: 86% of the learning occurring at higher education institutions is undergraduate education.

Chart 1 uses the Carnegie 2010 Basic classifications; I divided the higher education landscape into four simple categories; institutions that focus on four-year undergraduate and graduate education; institutions that primarily focuses on associates education; other or specialized institutions; and not applicable (using the exact Carnegie classification).

Chart 1: Number of Institutions and Enrollments


Second observation: The majority of undergraduate education occurs at schools that focus on four-year baccalaureate degrees or schools that also have graduate education (51.03%) but not far behind are schools that almost exclusively focus on associates or undergraduate education (42.15%).

Ivy and Ivy Equivalents:
The Ivy League and Ivy League equivalents get a lot of press. This is understandable because of the prestige, the notoriety, and the sheer wealth of these institutions. When I read higher education articles it seems that these institutions set the bar when it comes to higher education which in my opinion, is not right, is not feasible, and not realistic.

I went through the 7,764 institutions and categorized schools as part of the Ivy League, Ivy EQ (equivalent and private), Ivy EQ State (equivalent state schools), or Baby Ivy (primarily undergraduate). Chart 2 shows the 80 schools I, and others would consider to be part of the top tier of higher education institutions in the United States and their undergraduate and graduate enrollment.

Chart 2: Enrollments at Ivy and Ivy Equivalents


Third observation: Higher education press focus way too much attention on the 1% of the institutions that educate 3.83% of all undergraduates. It doubly focuses way too much time and energy on the Ivy League; those 8 institutions educate 0.36% of all undergraduates.

Graduation Rates:
Graduation rates are important but the problem with graduation rates is the limited manner in which it is measured. The government provides an excellent definition of the very specific metric it uses to measure 4, 5, and 6-year graduation rates.

When looking at the graduation rates for higher education it is nearly impossible to observe graduation rates for over half of the institutions. The institutions that are Carnegie classified as Associate's primarily focus is on associates level education and do not directly contribute to the 4, 5, or 6-year graduation metric. That means that we cannot use Graduation Rates to define the effectiveness of 1,826 institutions that teaches 42% of all undergraduates (there are other ways but Graduation Rate is always in the press).

This leaves the other half of higher education with mostly useable data about graduation rates. Chart 3 contains the Carnegie classified Baccalaureate, Masters, Doctoral, and Research institutions and their average Graduation Rate, mean Graduation Rate, and High(est) Graduation Rate for 4, 5, and 6-years. I did not put the lowest Graduation Rate because it was always in the single digit or teens. I also included the row, 'Ivy and Ivy EQ' as a comparison.

Chart 3: 4, 5, & 6-Year Graduation Rates


Fourth observation: Most higher education institutions struggle with graduation rates, the average 4-year Graduation Rate is 35.24% for the observed schools, and too much attention is given to the highest performing schools.

Chart 4 shows how the Graduation Rates for the for Carnegie classified Baccalaureate, Masters, Doctoral, and Research institutions are distributed. I divided the 100 point scale evenly with the number of institutions per row and the percentage of the total per 4, 5, & 6-year Graduate Rate. Some institutions did not provide Graduation Rates and some data was missing from IPEDS (Blanks).

Chart 4: Distribution of Graduation Rates


Fifth observation: The 6-year graduation rate is more applicable to today's college student.

Finally I graphed the Graduation Rate distribution but did not include the blanks. Graph 1 shows the Graduation Rate distribution for Carnegie classified Baccalaureate, Masters, Doctoral, and Research institutions (does not include Blanks).

Graph 1: Graduation Rate Distribution


Sixth observation: The six-year Graduation Rate is more akin to a bell curve than the 4 or 5-year Graduation Rate.

Conclusions:
My findings from this article is that the higher education community should: 1) use the 6-year Graduation Rate as a more realistic metric for institutions; 2) institutions with 'poor' Graduation Rates should get most of the attention to help improve their Graduation Rates; and 3) stop talking about the Ivy League and Ivy League equivalents, they are fine.


Besides those three broad statements I do not have any solid conclusions yet. Since this is my first foray into higher education enrollments in the United States I am curious to see where my research will go from here and how my observations and conclusions will change over time. 

Saturday, March 7, 2015

America's Worst Colleges

I think a lot about higher education. I know, obvious for someone who has worked in higher education their entire adult life but it is true, all of my work day and a substantial portion of my non-work time I think about higher education. When I read articles about colleges and universities I always want to read student success stories, how learning outcomes are improving, how at-risk students are being helped and encouraged to complete, but the one type of article that disappoints me the most are ones about the best and the worst colleges in the country.


The Best:
The best colleges are always the same. Northeast and midwest private schools with large endowments and cute campuses. Large state universities that are have a heavy research focus and good football teams. The quality of these institutions is never doubted even when there is little to no actual assessment data; legacy proof.


The Worst:
This brings me to the worst. I wrote about acceptance rates before and how US New and World Report has two lists (amongst many); 100 Highest Acceptance Rates and the 100 Lowest Acceptance Rates. This list implies, not subtlely, that schools with lower acceptance rates are better; this metric has been used for years to prove quality.


This brings me to an article titled, America’s Worst Colleges at the Washington Monthly. The description reads:
“We set out to make a list of the poorest-performing colleges. What we found is that, while good schools are basically all alike, every crappy school is crappy in its own way.”


Besides being awkward the description leads with negativity. As you read the article the writer does bring-up valid points about the difficulty of going to college, the debt many accumulate, graduation rates, net price to students, and the like. There are four different lists with twenty schools each with some schools appearing on multiple lists. The author explains the four lists and does a good job but he ever shares his metrics which as an online article makes sense, we just have to trust the numbers.


The one thing that that author does not address are the students and the socioeconomic factors that the schools have to deal with. It is like talking about the quality of a novel without actually talking about the words, the sentences, the chapters, the actual story, and the content.


Fast forward to the closing paragraph; although again the author tries to bring up valid and important issues in higher education he assumes too much.  
“The high quality of America’s best colleges creates a strong public belief that all U.S. institutions of higher education must be of similar quality. Top colleges lists reinforce this assumption, while the obsession over admissions sucks up all the air in public debates over college quality.”


I don’t know anyone who assumes that if you go to Arizona State University or Missouri State University the quality of education must be similar to Grinell College or Stanford (undergraduate education only). Is the content covered at those colleges similar? Yes, of course. You also cover the same course content at Shaw University as an undergrad that you do at Princeton; content and curriculum are not magic and there is no elite fairy dust that makes learning outcomes better at elite schools.


The next quote I find the author is just getting mean:
“This is a boon for those schools that are decidedly not world-class and that struggle with debt, cost, and completion. They fly under the radar with little attention and unearned positive reputations. And only the students who have the misfortune to enroll at one of these places find out the truth.


Not everyone can attend Brown University like the author and be high powered by 18. Often, poorer students, at-risk students, and underprepared students go to the local college that fits for them; not everyone can move to Providence, Rhode Island for four-years.


All colleges educate, students try to learn, faculty try to teach, staff try to support, and the administration try to keep it running with the tools and resources they have. To say that school have unearned positive reputations is insulting. Being overly snarky, elite schools have unearned positive reputations because we assume they are the best because of their large endowments, their low acceptance rates, and alumni success. Do these factors mean that undergraduate students learn more during their four years at an elite school? Prove it.


If we want to improve higher education and deal with college cost, the blame game cannot continue. When it comes to educating America’s adult learners I do not care what the elite colleges do, their students are fine and they have the cash to support them in pretty much any way possible. What I care about are the colleges and universities that are educating students who need help getting through school, are working multiple jobs, have kids, have life events occur during schools, et cetera. These are the students that need help attaining their undergraduate degrees and should not be insulted by calling the institutions they go to, the worst.


Sunday, February 22, 2015

Does the Prez Need a College Degree?

No. That was easy.

Does the US President need a college degree; of course not, but do most of them have one, or two, or three over the last few generations? Yes.

In the game of life, there are plenty of highly successful individuals who do not have college degrees; billionaires, tech giants, leading thinkers, writers, neighbours, and everyone else in-between. I am going to say something blasphemous for higher education: going to college does not automatically give you special insight into anything. But going to college does give you access to people, ideas, and situations that are very difficult to experience or have access to without college.

Music composition is a field where a college degree is not required for success. Anyone can start composing and gain the skills and techniques needed to write Classical music through self-study or private lessons. The problem with not going to college is access: when you go to college you have access to established composers, musicians to network with, and most importantly, you have access to musicians and ensembles who can play your works allowing you to test your ideas, get recordings of your pieces, and help you improve slowly and surely.

I am sure for some writing music seems a little out there when it comes to a field of study that can bypass college but any bookish field will be the same from history, philosophy, english, math, law, computers, writing, and even the performing arts. Other fields are different.

Many science fields, engineering, medicine, and teaching all require hands-on experience and because of regulation, they need lots of oversight. Do they all need such oversight? Yes and no. Many could prepare for these fields with a formal apprenticeship but most of those apprenticeships have been replaced by college.

All of this came about because Scott Walker, Governor of Wisconsin did not complete his degree. I don’t care. If Scott Walker can deliver the goods; be a leader of people, be thoughtful, back-up his arguments, balance budgets, and make decisions that benefit all (most) Americans then having a college degree does not matter.

In my mother’s lifetime, since 1945, Presidents of the United States attained the following degrees (highest):
  • 4 bachelors degrees;
  • 4 JDs;
  • 2 attended a Military Academy;
  • 1 MBA;
  • and 1 did not attain a college degree.

Of these, which type of preparation can really help you become Presidents of the United States? All of them. If you really want to become the Presidents of the United States you should probably attend a Military Academy and get a JD and an MBA on the way there. By doing this you have practical experience leading people in difficult situations, you know law, and are businesses minded.

Da Capo

Do you need a college degree to be Presidents of the United States? No. Anyone can chart their own path through life without a college degree. The only problem with that is that not having a degree is the exception rather than the norm. For average people many good paying jobs require a degree and unfortunately not having a college degree, even if you have the real-life practical knowhow, is required.

Thursday, July 24, 2014

College ROI

Over the last decade costs associated with higher education have been under intense scrutiny by pretty much everyone. This has led some writers and commentators to look at higher education in relation to the private sector and for some, as an investment. This led to the 2014 College ROI Report for undergraduate education, a service of to Payscale.com. Below is what Payscale states about the College ROI Report:
“How do you measure the value of a college education? PayScale has the salary data to rank hundreds of U.S. colleges and universities based on total cost and alumni earnings. Find the best returns on investment by school type, location, major and more.”


Return on investment is a simple concept; how much of a return did you get versus how much invested. Great when you are talking about how much you invested in Ford or Apple but does it work with a college education? As PayScale states in their methodology; the College ROI is based on the costs associated with attending college, easy to find; and the return, or earnings is based on having surveyed 1.4 million alumni. I will not comment on surveying alumni earnings, I will assume the data is solid.


For my evaluation of the College ROI Report, I used the following criteria when I used the ROI in May of 2014:
- With financial aid (most people get some sort of help when going to college);
- On campus housing (assuming you have the typical college experience);
- All institutions (looking at all institutions);
- Deleted all Out-of-State costs (assuming you are going in-state or will get a scholarship/aid to make tuition equivalent to in-state).
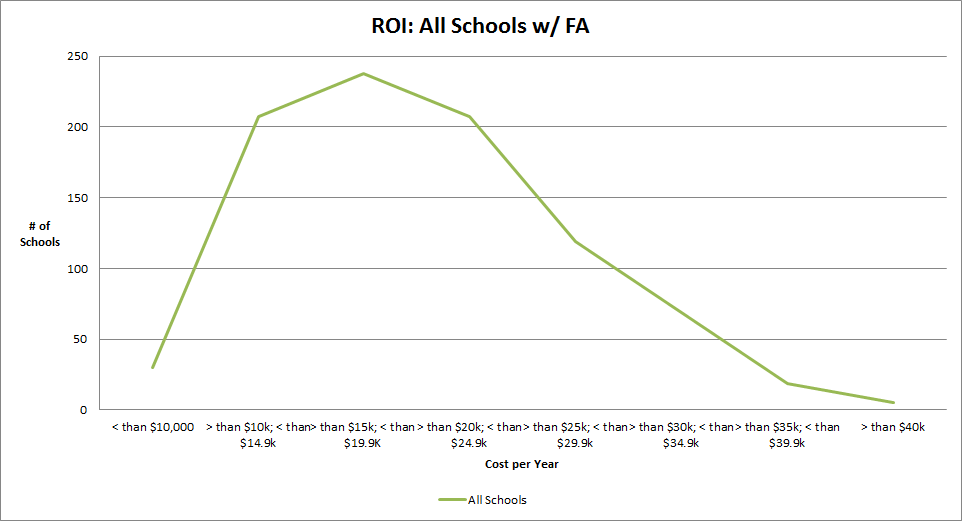
Chart 1: All Schools; Cost per Year with Financial Aid.


Chart 1 contains where all 897 schools fall in relation to cost per year. This chart is pretty close to what one would expect; most schools are below $25k per year with the median $19,192 and the average $20,271.


Next, I am going to look at the College ROI Report and focus on the top-100 20 Year Net ROI and top-100 Annual ROI schools and compare the two lists. Note; 57 schools are shared from the top-100 20 Year Net ROI to the top-100 Annual ROI.


The reason I decided to look at the top 100, or top 11% of the College ROI Report is to get an idea of what prospective students and parents see when they peruse the report. Most people, when presented with data that contains over 1,000 rows and several columns will not look over every single datum; they look at the top, the bottom, what is around them locally, and what is already on their ‘radar’.


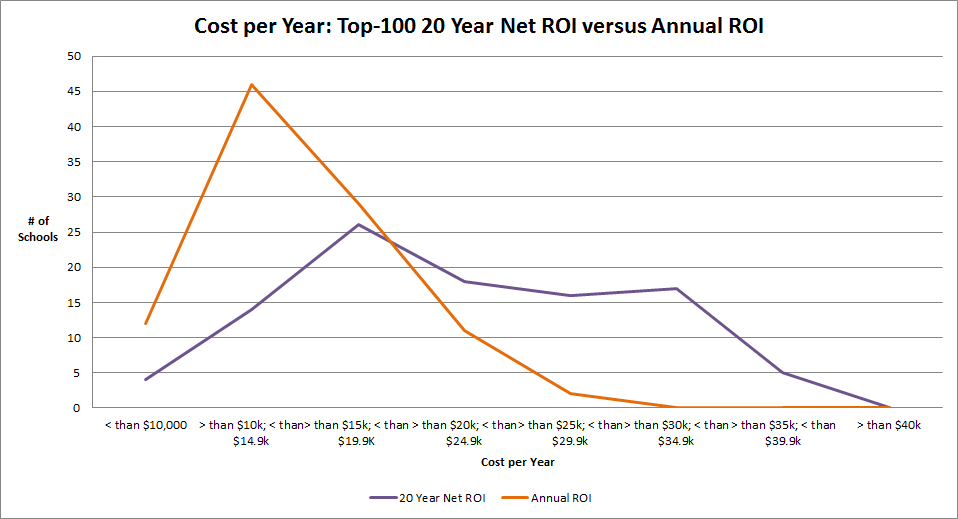
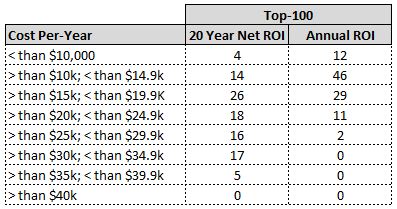
Chart 2: Cost per Year; Top-100 20 Year Net ROI and Top-100 Annual ROI


Chart 2 shows where the top-100 20 Year Net ROI and top-100 Annual ROI schools fall when looking at cost per year. The results are standard: schools with better 20 Year Net ROI are more expensive while schools with better Annual ROI are varied with most many being less expensive.


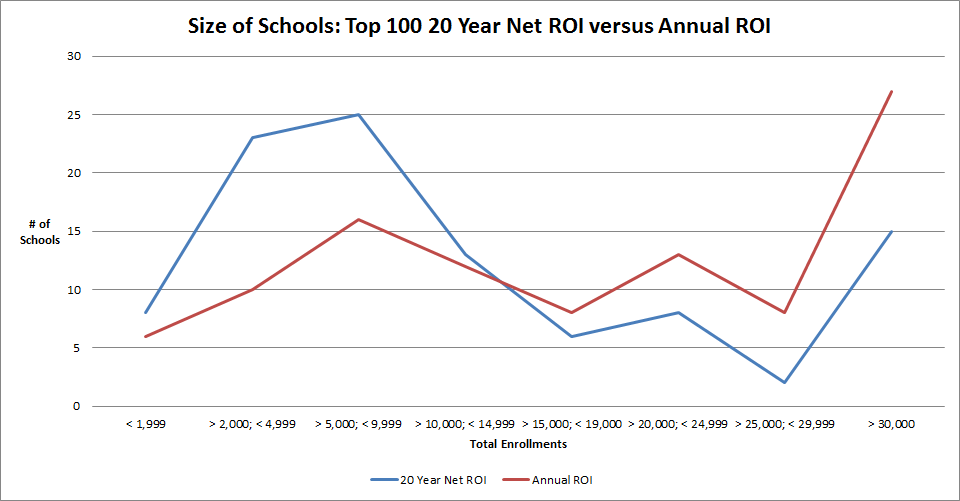
Chart 3: Size of Schools; Top-100 20 Year Net ROI and Top-100 Annual ROI


Chart 3 shows the enrollments, or size of the schools of the top-100 20 Year Net ROI and top-100 Annual ROI. Again, pretty standard. Schools with higher 20 Year Net ROI are more often than not smaller compared to schools that have better Annual ROI with the exception of the large flagship and large private institutions.


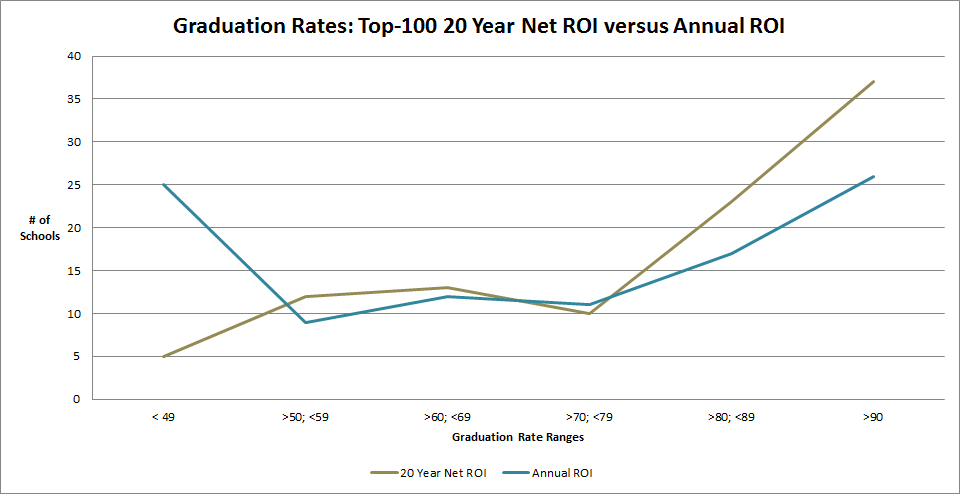
Chart 4: Graduation rates; Top-100 20 Year Net ROI and Top-100 Annual ROI


My final chart, Chart 4 shows the graduation rates for the top-100 20 Year Net ROI and top-100 Annual ROI. Expected. More Annual ROI schools have lower graduation rates while 20 Year Net ROI schools have better graduation rates.


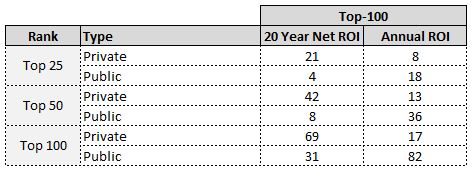
Table 1: Private or Public; Top-100 20 Year Net ROI and Top-100 Annual ROI Ranked
100PubPriv.JPG


Table 1 shows the top-100 20 Year Net ROI and top-100 Annual ROI and divides them in top 25, 50, and 100 to see the division between public and private institutions. By far the majority of schools on the 20 Year Net ROI are private and the majority of schools on the Annual ROI are public. I assume graduates of these private institutions get an income bump giving them a higher 20 Year Net ROI while graduates of these public institutions do not benefit from an income bump but have a higher Annual ROI because their schooling did not cost as much.

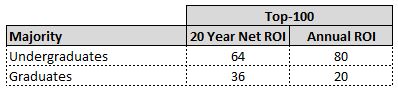
Table 2: Majority Undergraduate or Graduate? Top-100 20 Year Net ROI and Top-100 Annual ROI
100UnderGrad.JPG


Table 2 shows if the top-100 20 Year Net ROI and top-100 Annual ROI have majority undergraduate or graduates. The majority of the institutions for both lists are, by enrollment, majority undergraduate. This is good but this does not mean that all of these schools solely focus on undergraduates; Vanderbilt has more undergraduates than graduates but most of the money the school has goes to research rather than purely undergraduate education.


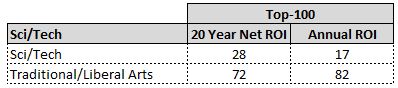
Table 3: Sci/Tech or Traditional/Liberal Arts? Top-100 20 Year Net ROI and Top-100 Annual ROI
100SciTrad.JPG


Table 3 contains how many of the top-100 20 Year Net ROI and top-100 Annual ROI have a science or technology focus rather than being a traditional or liberal arts college. Science and technology jobs generally pay more so it makes sense that schools like Harvey Mudd College and Rose-Hulman are on the top-100 20 Year Net ROI while a few of them would not be on the top-100 Annual because they are more expensive to attend.


Discussion:
Payscale’s College ROI Report is a nice tool; it allows prospective students and parents to look at schools around the country and compare them to each other when it comes to simple financial means.


With that said the schools that occupy the ‘top’ spots are all the usual suspects; Ivy League, Ivy League equivalents, baby Ivies, Sci/Tech schools and flagship public schools. The information that the College ROI Report tells us is not that unique; Harvey Mudd College, Ivy League schools, Cal Tech, Williams College, and John Hopkins deliver excellent 20 Year Net ROI and the University of Virginia, Ivy League Schools, Cal Tech, Williams, and John Hopkins deliver excellent Annual ROI (57 schools are the same from 20 Year Net ROI to Annual ROI).


How you use the College ROI Report depends on what schools you are looking at. If you are looking at the Ivy League, Ivy League equivalents, or baby Ivies then this report will bolster your already high opinion of these schools. If you are look at the flagship publics then this report will help you see subtle difference between them. If you are looking at this report for provincial schools or smaller not as ‘well known’ private institutions then this report will confuse you and/or discourage you from looking at some schools.


When you go to the bottom of the 20 Year Net ROI and see Seton Hall, University of North Carolina at Pembroke, Morehead State University, and Savannah State University are you not going to look at these schools because they are at the bottom of this list? They could be at the bottom of this list because Payscale did not survey enough of their graduates to get a true picture of alumni earnings. What if the school you want to attend is not on this list?

Conclusion:
Like all tools out there Payscale’s College ROI Report is just one of many. Use it to get a snapshot of potential ROI of a college degree from specific college but understand that like many predictive tools, it is helpful only to a point.


Addendum:
The following are all the tables that I used to create the charts used in the article.


Table 4: All Schools with Cost per Year Ranges
AllSchools.JPG


Table 5: Cost Per Year for the Top-100 Schools 20 Year Net ROI and Top-100 Schools Annual ROI
100CostYear.JPG


Table 6: Size of Top-100 20 Year Net ROI and Top-100 Annual ROI schools

100SizeSchools.JPG


Thursday, May 15, 2014

...Advantage

So...I am not sure how to write about this. Generally I avoid race in my writing but I have read so many articles about white privilege that it is hard to ignore. So here I go.

Disclosure: I am white and male.

With that out of the way let’s talk about what I call educational advantage. I wanted to write about educational advantage after reading The Atlantic article, Checking Privilege Checking by Phoebe Bovy about a Princeton freshman. Dr. Bovy’s article has many excellent points and so does the article by the Princeton freshman at the Princeton Tory. After reading both articles and the New York Times article I was struck by one simple fact: we don’t know what that freshman is truly like besides his article and word of mouth. From the three articles it seems like the whole reason there is controversy is because this freshman is (1) at Princeton and (2) an unapologetic conservative.

In my life I don’t care if you are liberal, moderate, conservative, rightist, leftist, Tea Party, Green, a modern Commie, a Free Capitalist, or whatever, all I care about is what you bring to the table and if you can have an open and constructive dialogue. In the article at the Princeton Tory the Princeton freshman states he has been told several times to ‘check his privilege’ and his article is his response to this. In the article his family’s narrative is amazing and heartbreaking, and I applaud him for his accomplishments; I don’t think anyone faults him for making it to Princeton and what he has done to this point in his life.

It seems to me that most of the controversy comes not from the article but with the Princeton freshman himself and the fact that he seems to be an unapologetic conservative. Again, I don’t know that he is a conservative, I don’t care if he does not support the President but from my read of the situation it seems that he might be an argumentative person and if he is and if he brings politics into everything he does then it makes sense that he has been asked to ‘check his privilege’ by some people at Princeton. I am not saying it is right, I am not defending those who have tried to ‘check’ him but when presented with someone who bloviates without the ability to have a constructive dialogue some respond in-kind.

If this article would have appeared at Rutgers or Seton Hall we would not be talking about it but because it appeared at Princeton everyone is talking about it. With my discussion of the Princeton freshman out of the way I am going to talk about what I am calling educational advantage.

I am sure there is a proper higher education and sociological term for educational advantage but I am not familiar with it. I am not going to use the term white privilege because as Dr. Bovy said, “‘Privilege’  isn't merely unearned advantage—it implies entitlement… advantage about which one is unaware.” Excellent definition and not applicable to what I am going to discuss moving forward.

To start off I will discuss my educational advantage. First; since educational advantage is often about money my father was enlisted in the Army and my mother was a nurse. They worked hard and provided a great deal for me and my brother. Is this an advantage? Well, my parents were together which is an advantage compared to some. Were we rich? No; not an advantage when discussing white privilege. Were we middle-class? Yes; an advantage when holistically discussing higher education (it is an advantage to be in the middle).

My biggest advantage, in my opinion, is the fact that I have been largely anonymous most of my life. As a teenager and young adult  I could go anywhere and people would barely notice me. Even today when I drive my silver midsize family sedan, wear business casual, and have the same haircut as my son; people barely notice me.

How is this an advantage? Well, it has allowed me to live my life without having to worry about my personal safety. Does every 16 or 20 year old black or hispanic male go through the same experience of being anonymous? Yes and unfortunately no. So my biggest advantage has been that no one really notices me yet this has allowed my body of work, my accomplishments, and my character to be what people judge me on. As stated in the New York Time article by a different Princeton freshman, “He [the original Princeton freshman] doesn’t know what it feels like to be judged by his race...I don’t think I’ve met an African-American who believes that they are judged solely by their character.”

So where do we go from here? When talking to someone, anyone, you should do the following: (1) look them in the eyes; (2) listen to their narrative; (3) do not dismiss their personal experiences; (4) acknowledge their accomplishments; (5) accept them for the person they are and what they have gone through; and (6) only judge them on their character.

Da Capo. It seems like in the story of the Princeton freshman and the people he was ‘checked’ by did not follow the six points above (these points are not comprehensive). You should only give constructive criticism to people you know or to friends you have build rapport with. You should never ‘check’ anyone you just met and you do not get any college awesomeness points for ‘checking’ an unapologetic conservative (or liberal) you barely know.

With that said, I know college kids like to argue, after all they have figured out the world by age 20 and often feel like they have accomplished something when they have the opportunity to defend their ‘core’ beliefs but at the end of the day what does this type of arguing accomplish?

You can only influence people by getting to know them, building trust, and having an open and honest dialogue with them. Change only occurs when two people sit down, start talking, share a cup of coffee, and start understanding each other.