Over the last decade costs associated with higher education have been under intense scrutiny by pretty much everyone. This has led some writers and commentators to look at higher education in relation to the private sector and for some, as an investment. This led to the 2014 College ROI Report for undergraduate education, a service of to Payscale.com. Below is what Payscale states about the College ROI Report:
“How do you measure the value of a college education? PayScale has the salary data to rank hundreds of U.S. colleges and universities based on total cost and alumni earnings. Find the best returns on investment by school type, location, major and more.”
Return on investment is a simple concept; how much of a return did you get versus how much invested. Great when you are talking about how much you invested in Ford or Apple but does it work with a college education? As PayScale states in their methodology; the College ROI is based on the costs associated with attending college, easy to find; and the return, or earnings is based on having surveyed 1.4 million alumni. I will not comment on surveying alumni earnings, I will assume the data is solid.
For my evaluation of the College ROI Report, I used the following criteria when I used the ROI in May of 2014:
- With financial aid (most people get some sort of help when going to college);
- On campus housing (assuming you have the typical college experience);
- All institutions (looking at all institutions);
- Deleted all Out-of-State costs (assuming you are going in-state or will get a scholarship/aid to make tuition equivalent to in-state).
Chart 1: All Schools; Cost per Year with Financial Aid.
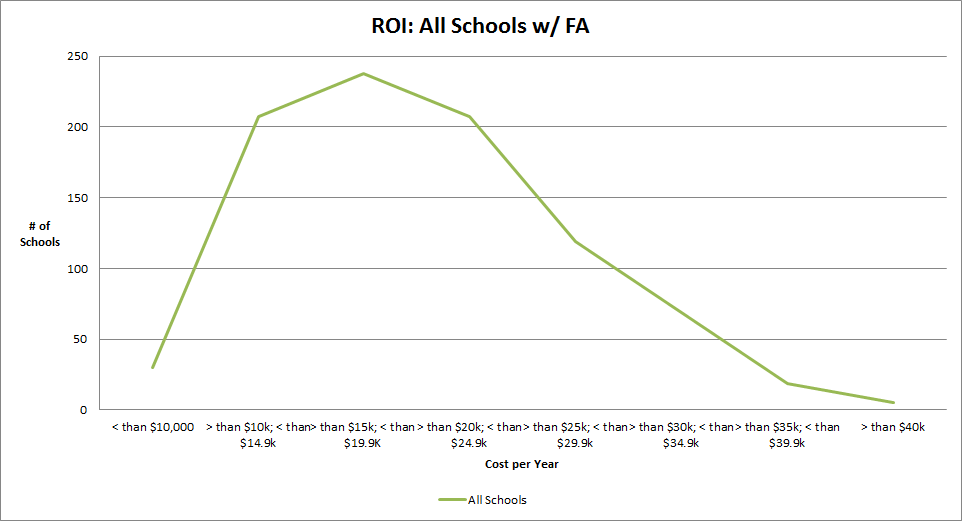
Chart 1 contains where all 897 schools fall in relation to cost per year. This chart is pretty close to what one would expect; most schools are below $25k per year with the median $19,192 and the average $20,271.
Next, I am going to look at the College ROI Report and focus on the top-100 20 Year Net ROI and top-100 Annual ROI schools and compare the two lists. Note; 57 schools are shared from the top-100 20 Year Net ROI to the top-100 Annual ROI.
The reason I decided to look at the top 100, or top 11% of the College ROI Report is to get an idea of what prospective students and parents see when they peruse the report. Most people, when presented with data that contains over 1,000 rows and several columns will not look over every single datum; they look at the top, the bottom, what is around them locally, and what is already on their ‘radar’.
Chart 2: Cost per Year; Top-100 20 Year Net ROI and Top-100 Annual ROI
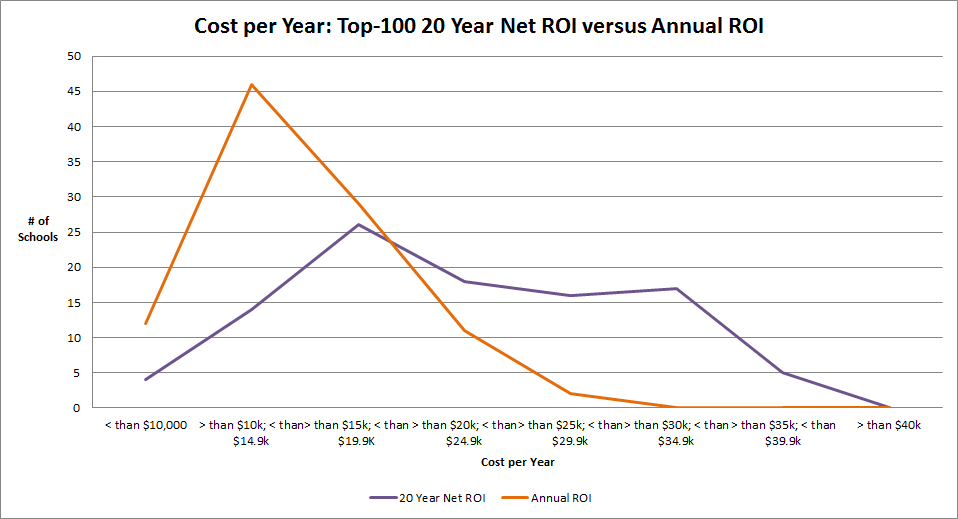
Chart 2 shows where the top-100 20 Year Net ROI and top-100 Annual ROI schools fall when looking at cost per year. The results are standard: schools with better 20 Year Net ROI are more expensive while schools with better Annual ROI are varied with most many being less expensive.
Chart 3: Size of Schools; Top-100 20 Year Net ROI and Top-100 Annual ROI
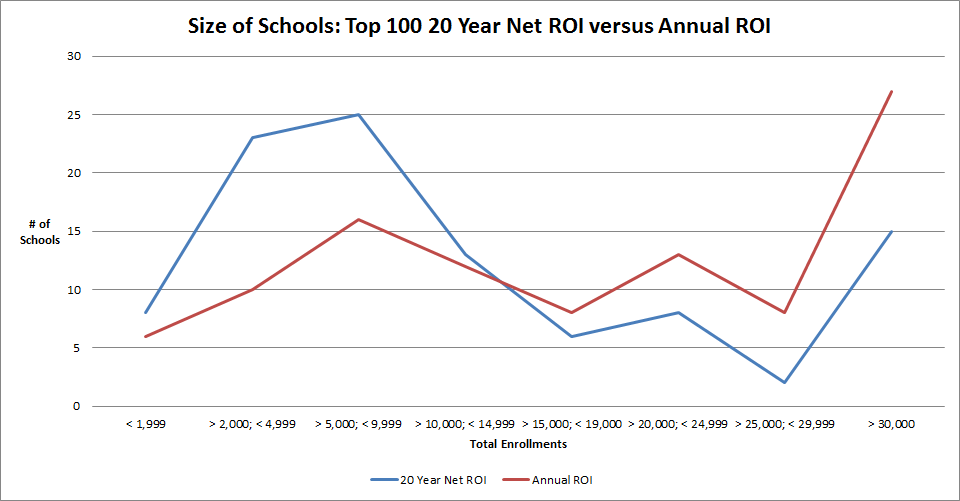
Chart 3 shows the enrollments, or size of the schools of the top-100 20 Year Net ROI and top-100 Annual ROI. Again, pretty standard. Schools with higher 20 Year Net ROI are more often than not smaller compared to schools that have better Annual ROI with the exception of the large flagship and large private institutions.
Chart 4: Graduation rates; Top-100 20 Year Net ROI and Top-100 Annual ROI
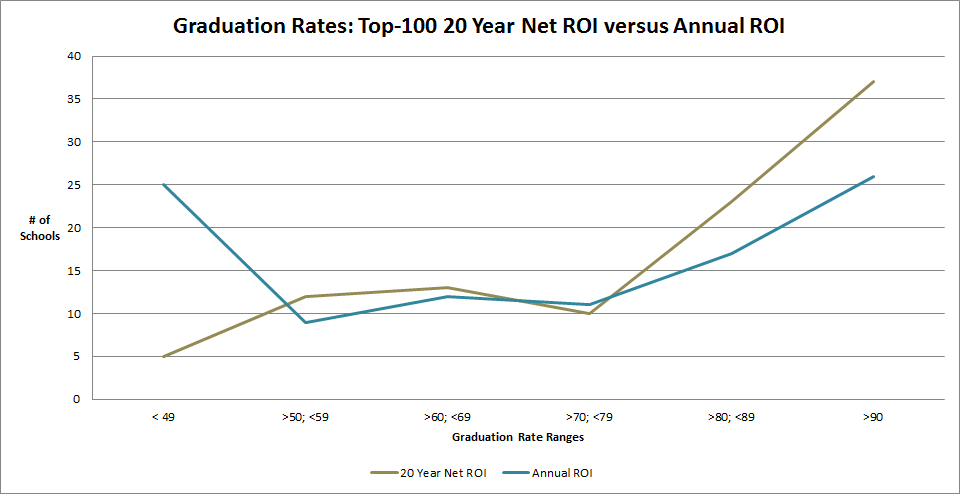
My final chart, Chart 4 shows the graduation rates for the top-100 20 Year Net ROI and top-100 Annual ROI. Expected. More Annual ROI schools have lower graduation rates while 20 Year Net ROI schools have better graduation rates.
Table 1: Private or Public; Top-100 20 Year Net ROI and Top-100 Annual ROI Ranked
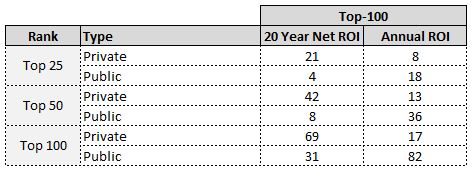
Table 1 shows the top-100 20 Year Net ROI and top-100 Annual ROI and divides them in top 25, 50, and 100 to see the division between public and private institutions. By far the majority of schools on the 20 Year Net ROI are private and the majority of schools on the Annual ROI are public. I assume graduates of these private institutions get an income bump giving them a higher 20 Year Net ROI while graduates of these public institutions do not benefit from an income bump but have a higher Annual ROI because their schooling did not cost as much.
Table 2: Majority Undergraduate or Graduate? Top-100 20 Year Net ROI and Top-100 Annual ROI
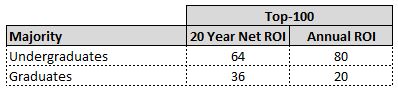
Table 2 shows if the top-100 20 Year Net ROI and top-100 Annual ROI have majority undergraduate or graduates. The majority of the institutions for both lists are, by enrollment, majority undergraduate. This is good but this does not mean that all of these schools solely focus on undergraduates; Vanderbilt has more undergraduates than graduates but most of the money the school has goes to research rather than purely undergraduate education.
Table 3: Sci/Tech or Traditional/Liberal Arts? Top-100 20 Year Net ROI and Top-100 Annual ROI
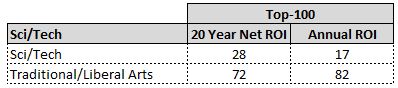
Table 3 contains how many of the top-100 20 Year Net ROI and top-100 Annual ROI have a science or technology focus rather than being a traditional or liberal arts college. Science and technology jobs generally pay more so it makes sense that schools like Harvey Mudd College and Rose-Hulman are on the top-100 20 Year Net ROI while a few of them would not be on the top-100 Annual because they are more expensive to attend.
Discussion:
Payscale’s College ROI Report is a nice tool; it allows prospective students and parents to look at schools around the country and compare them to each other when it comes to simple financial means.
With that said the schools that occupy the ‘top’ spots are all the usual suspects; Ivy League, Ivy League equivalents, baby Ivies, Sci/Tech schools and flagship public schools. The information that the College ROI Report tells us is not that unique; Harvey Mudd College, Ivy League schools, Cal Tech, Williams College, and John Hopkins deliver excellent 20 Year Net ROI and the University of Virginia, Ivy League Schools, Cal Tech, Williams, and John Hopkins deliver excellent Annual ROI (57 schools are the same from 20 Year Net ROI to Annual ROI).
How you use the College ROI Report depends on what schools you are looking at. If you are looking at the Ivy League, Ivy League equivalents, or baby Ivies then this report will bolster your already high opinion of these schools. If you are look at the flagship publics then this report will help you see subtle difference between them. If you are looking at this report for provincial schools or smaller not as ‘well known’ private institutions then this report will confuse you and/or discourage you from looking at some schools.
When you go to the bottom of the 20 Year Net ROI and see Seton Hall, University of North Carolina at Pembroke, Morehead State University, and Savannah State University are you not going to look at these schools because they are at the bottom of this list? They could be at the bottom of this list because Payscale did not survey enough of their graduates to get a true picture of alumni earnings. What if the school you want to attend is not on this list?
Conclusion:
Like all tools out there Payscale’s College ROI Report is just one of many. Use it to get a snapshot of potential ROI of a college degree from specific college but understand that like many predictive tools, it is helpful only to a point.
Addendum:
The following are all the tables that I used to create the charts used in the article.
Table 4: All Schools with Cost per Year Ranges

Table 5: Cost Per Year for the Top-100 Schools 20 Year Net ROI and Top-100 Schools Annual ROI
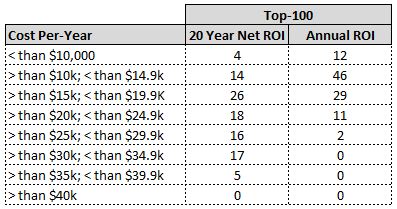
Table 6: Size of Top-100 20 Year Net ROI and Top-100 Annual ROI schools


No comments:
Post a Comment