Showing posts with label #budgetrealities. Show all posts

Friday, March 27, 2015

Higher Education Enrollment and Graduation Rate: Initial Thoughts

One of my research interests is higher education enrollment. What I mean by this is how many students are enrolled at the many different types of higher education institutions in the United States . This interest stems from my job where the vast majority of students who attend the university I work and teach at are students with many risk factors that contribute to the difficult task of completing a traditional 120 credit undergraduate degree within four to six years. I also taught at community colleges in Arizona where the student demographic has a similar student profile.

Institutions who educate at-risk students are often harshly criticized in the higher education community for poor graduation rates while other institutions are lauded for high graduation rates. Articles at The Chronicle and Inside Higher Education seem to reflect an inherent bias towards associates education and focuses on higher performing undergraduate and graduate institutions, faculty, and students. In this article I will merely present data about higher education enrollments as I work on where to take my initial thoughts and observations.  

Higher Education Enrollment Data:
Using the IPEDS Data Center I downloaded data for all higher education institutions in North America for the academic year 2013 (the most recent available). There are dozens and dozens of reports you can create using IPEDS and for this initial investigation I downloaded: total enrollment, undergraduate enrollment, graduate enrollment, 4, 5, and 6-year undergraduate graduation rate, and the 2010 Basic Carnegie Classification for all institutions.

There are a lot of higher education institutions in the United States. There are 7,764 institutions with a total enrollment of 22,180,669; 18,233,606 undergraduate and 2,947,063 graduate students.

First observation: 86% of the learning occurring at higher education institutions is undergraduate education.

Chart 1 uses the Carnegie 2010 Basic classifications; I divided the higher education landscape into four simple categories; institutions that focus on four-year undergraduate and graduate education; institutions that primarily focuses on associates education; other or specialized institutions; and not applicable (using the exact Carnegie classification).

Chart 1: Number of Institutions and Enrollments


Second observation: The majority of undergraduate education occurs at schools that focus on four-year baccalaureate degrees or schools that also have graduate education (51.03%) but not far behind are schools that almost exclusively focus on associates or undergraduate education (42.15%).

Ivy and Ivy Equivalents:
The Ivy League and Ivy League equivalents get a lot of press. This is understandable because of the prestige, the notoriety, and the sheer wealth of these institutions. When I read higher education articles it seems that these institutions set the bar when it comes to higher education which in my opinion, is not right, is not feasible, and not realistic.

I went through the 7,764 institutions and categorized schools as part of the Ivy League, Ivy EQ (equivalent and private), Ivy EQ State (equivalent state schools), or Baby Ivy (primarily undergraduate). Chart 2 shows the 80 schools I, and others would consider to be part of the top tier of higher education institutions in the United States and their undergraduate and graduate enrollment.

Chart 2: Enrollments at Ivy and Ivy Equivalents


Third observation: Higher education press focus way too much attention on the 1% of the institutions that educate 3.83% of all undergraduates. It doubly focuses way too much time and energy on the Ivy League; those 8 institutions educate 0.36% of all undergraduates.

Graduation Rates:
Graduation rates are important but the problem with graduation rates is the limited manner in which it is measured. The government provides an excellent definition of the very specific metric it uses to measure 4, 5, and 6-year graduation rates.

When looking at the graduation rates for higher education it is nearly impossible to observe graduation rates for over half of the institutions. The institutions that are Carnegie classified as Associate's primarily focus is on associates level education and do not directly contribute to the 4, 5, or 6-year graduation metric. That means that we cannot use Graduation Rates to define the effectiveness of 1,826 institutions that teaches 42% of all undergraduates (there are other ways but Graduation Rate is always in the press).

This leaves the other half of higher education with mostly useable data about graduation rates. Chart 3 contains the Carnegie classified Baccalaureate, Masters, Doctoral, and Research institutions and their average Graduation Rate, mean Graduation Rate, and High(est) Graduation Rate for 4, 5, and 6-years. I did not put the lowest Graduation Rate because it was always in the single digit or teens. I also included the row, 'Ivy and Ivy EQ' as a comparison.

Chart 3: 4, 5, & 6-Year Graduation Rates


Fourth observation: Most higher education institutions struggle with graduation rates, the average 4-year Graduation Rate is 35.24% for the observed schools, and too much attention is given to the highest performing schools.

Chart 4 shows how the Graduation Rates for the for Carnegie classified Baccalaureate, Masters, Doctoral, and Research institutions are distributed. I divided the 100 point scale evenly with the number of institutions per row and the percentage of the total per 4, 5, & 6-year Graduate Rate. Some institutions did not provide Graduation Rates and some data was missing from IPEDS (Blanks).

Chart 4: Distribution of Graduation Rates


Fifth observation: The 6-year graduation rate is more applicable to today's college student.

Finally I graphed the Graduation Rate distribution but did not include the blanks. Graph 1 shows the Graduation Rate distribution for Carnegie classified Baccalaureate, Masters, Doctoral, and Research institutions (does not include Blanks).

Graph 1: Graduation Rate Distribution


Sixth observation: The six-year Graduation Rate is more akin to a bell curve than the 4 or 5-year Graduation Rate.

Conclusions:
My findings from this article is that the higher education community should: 1) use the 6-year Graduation Rate as a more realistic metric for institutions; 2) institutions with 'poor' Graduation Rates should get most of the attention to help improve their Graduation Rates; and 3) stop talking about the Ivy League and Ivy League equivalents, they are fine.


Besides those three broad statements I do not have any solid conclusions yet. Since this is my first foray into higher education enrollments in the United States I am curious to see where my research will go from here and how my observations and conclusions will change over time. 

Thursday, July 24, 2014

College ROI

Over the last decade costs associated with higher education have been under intense scrutiny by pretty much everyone. This has led some writers and commentators to look at higher education in relation to the private sector and for some, as an investment. This led to the 2014 College ROI Report for undergraduate education, a service of to Payscale.com. Below is what Payscale states about the College ROI Report:
“How do you measure the value of a college education? PayScale has the salary data to rank hundreds of U.S. colleges and universities based on total cost and alumni earnings. Find the best returns on investment by school type, location, major and more.”


Return on investment is a simple concept; how much of a return did you get versus how much invested. Great when you are talking about how much you invested in Ford or Apple but does it work with a college education? As PayScale states in their methodology; the College ROI is based on the costs associated with attending college, easy to find; and the return, or earnings is based on having surveyed 1.4 million alumni. I will not comment on surveying alumni earnings, I will assume the data is solid.


For my evaluation of the College ROI Report, I used the following criteria when I used the ROI in May of 2014:
- With financial aid (most people get some sort of help when going to college);
- On campus housing (assuming you have the typical college experience);
- All institutions (looking at all institutions);
- Deleted all Out-of-State costs (assuming you are going in-state or will get a scholarship/aid to make tuition equivalent to in-state).
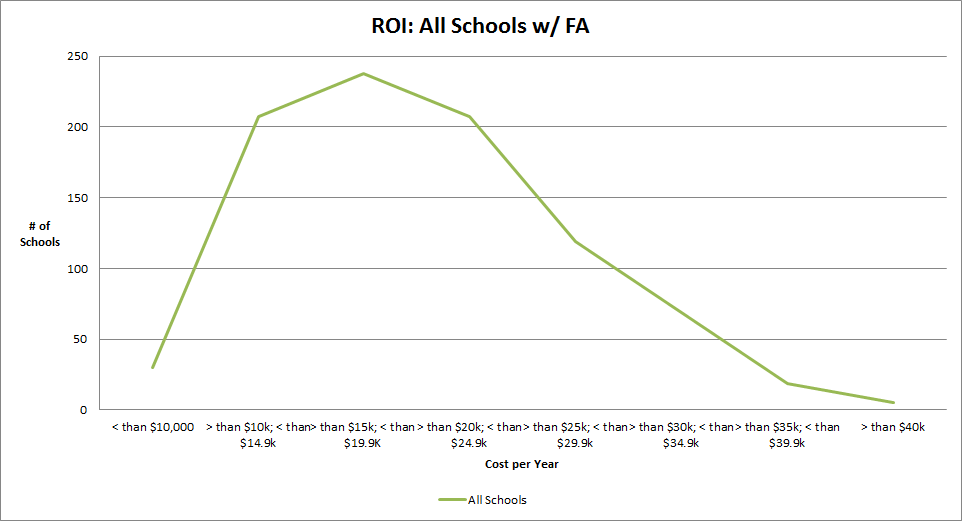
Chart 1: All Schools; Cost per Year with Financial Aid.


Chart 1 contains where all 897 schools fall in relation to cost per year. This chart is pretty close to what one would expect; most schools are below $25k per year with the median $19,192 and the average $20,271.


Next, I am going to look at the College ROI Report and focus on the top-100 20 Year Net ROI and top-100 Annual ROI schools and compare the two lists. Note; 57 schools are shared from the top-100 20 Year Net ROI to the top-100 Annual ROI.


The reason I decided to look at the top 100, or top 11% of the College ROI Report is to get an idea of what prospective students and parents see when they peruse the report. Most people, when presented with data that contains over 1,000 rows and several columns will not look over every single datum; they look at the top, the bottom, what is around them locally, and what is already on their ‘radar’.


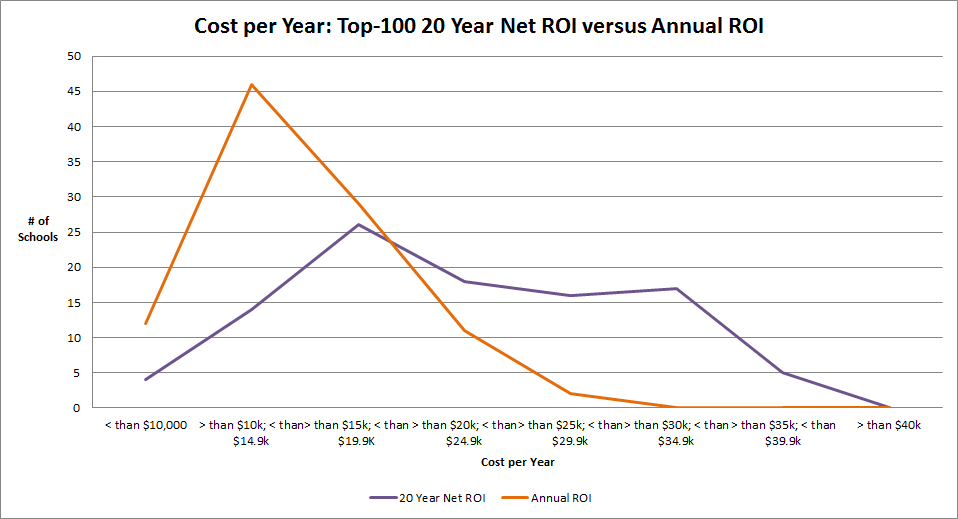
Chart 2: Cost per Year; Top-100 20 Year Net ROI and Top-100 Annual ROI


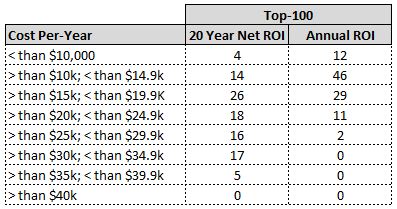
Chart 2 shows where the top-100 20 Year Net ROI and top-100 Annual ROI schools fall when looking at cost per year. The results are standard: schools with better 20 Year Net ROI are more expensive while schools with better Annual ROI are varied with most many being less expensive.


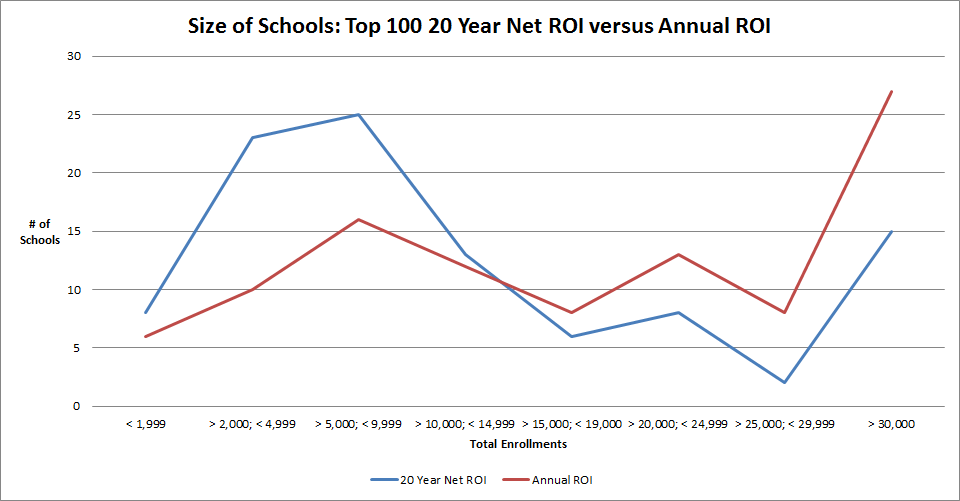
Chart 3: Size of Schools; Top-100 20 Year Net ROI and Top-100 Annual ROI


Chart 3 shows the enrollments, or size of the schools of the top-100 20 Year Net ROI and top-100 Annual ROI. Again, pretty standard. Schools with higher 20 Year Net ROI are more often than not smaller compared to schools that have better Annual ROI with the exception of the large flagship and large private institutions.


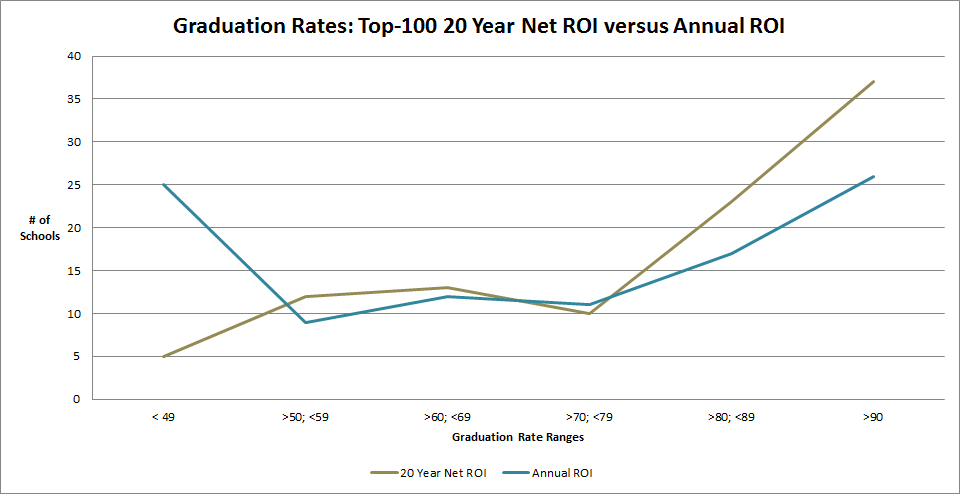
Chart 4: Graduation rates; Top-100 20 Year Net ROI and Top-100 Annual ROI


My final chart, Chart 4 shows the graduation rates for the top-100 20 Year Net ROI and top-100 Annual ROI. Expected. More Annual ROI schools have lower graduation rates while 20 Year Net ROI schools have better graduation rates.


Table 1: Private or Public; Top-100 20 Year Net ROI and Top-100 Annual ROI Ranked
100PubPriv.JPG


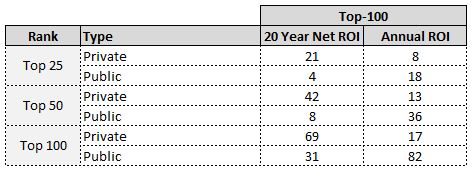
Table 1 shows the top-100 20 Year Net ROI and top-100 Annual ROI and divides them in top 25, 50, and 100 to see the division between public and private institutions. By far the majority of schools on the 20 Year Net ROI are private and the majority of schools on the Annual ROI are public. I assume graduates of these private institutions get an income bump giving them a higher 20 Year Net ROI while graduates of these public institutions do not benefit from an income bump but have a higher Annual ROI because their schooling did not cost as much.

Table 2: Majority Undergraduate or Graduate? Top-100 20 Year Net ROI and Top-100 Annual ROI
100UnderGrad.JPG


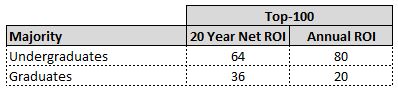
Table 2 shows if the top-100 20 Year Net ROI and top-100 Annual ROI have majority undergraduate or graduates. The majority of the institutions for both lists are, by enrollment, majority undergraduate. This is good but this does not mean that all of these schools solely focus on undergraduates; Vanderbilt has more undergraduates than graduates but most of the money the school has goes to research rather than purely undergraduate education.


Table 3: Sci/Tech or Traditional/Liberal Arts? Top-100 20 Year Net ROI and Top-100 Annual ROI
100SciTrad.JPG


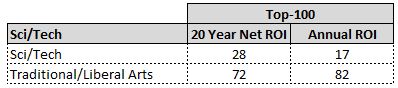
Table 3 contains how many of the top-100 20 Year Net ROI and top-100 Annual ROI have a science or technology focus rather than being a traditional or liberal arts college. Science and technology jobs generally pay more so it makes sense that schools like Harvey Mudd College and Rose-Hulman are on the top-100 20 Year Net ROI while a few of them would not be on the top-100 Annual because they are more expensive to attend.


Discussion:
Payscale’s College ROI Report is a nice tool; it allows prospective students and parents to look at schools around the country and compare them to each other when it comes to simple financial means.


With that said the schools that occupy the ‘top’ spots are all the usual suspects; Ivy League, Ivy League equivalents, baby Ivies, Sci/Tech schools and flagship public schools. The information that the College ROI Report tells us is not that unique; Harvey Mudd College, Ivy League schools, Cal Tech, Williams College, and John Hopkins deliver excellent 20 Year Net ROI and the University of Virginia, Ivy League Schools, Cal Tech, Williams, and John Hopkins deliver excellent Annual ROI (57 schools are the same from 20 Year Net ROI to Annual ROI).


How you use the College ROI Report depends on what schools you are looking at. If you are looking at the Ivy League, Ivy League equivalents, or baby Ivies then this report will bolster your already high opinion of these schools. If you are look at the flagship publics then this report will help you see subtle difference between them. If you are looking at this report for provincial schools or smaller not as ‘well known’ private institutions then this report will confuse you and/or discourage you from looking at some schools.


When you go to the bottom of the 20 Year Net ROI and see Seton Hall, University of North Carolina at Pembroke, Morehead State University, and Savannah State University are you not going to look at these schools because they are at the bottom of this list? They could be at the bottom of this list because Payscale did not survey enough of their graduates to get a true picture of alumni earnings. What if the school you want to attend is not on this list?

Conclusion:
Like all tools out there Payscale’s College ROI Report is just one of many. Use it to get a snapshot of potential ROI of a college degree from specific college but understand that like many predictive tools, it is helpful only to a point.


Addendum:
The following are all the tables that I used to create the charts used in the article.


Table 4: All Schools with Cost per Year Ranges
AllSchools.JPG


Table 5: Cost Per Year for the Top-100 Schools 20 Year Net ROI and Top-100 Schools Annual ROI
100CostYear.JPG


Table 6: Size of Top-100 20 Year Net ROI and Top-100 Annual ROI schools

100SizeSchools.JPG


Saturday, June 14, 2014

Correct College Pricing?

Ah, Jeffrey Dorfman. In my earlier article, Respectfully Disagree about Big Time College Sports I disagreed with Dr. Dorfman and his view of how much college football players are compensated. In a recent article about how much college costs, I largely agree with Dr. Dorfman views but respectfully disagree with a few of his details.


Before I start, I want to reiterate one of my biggest complaints about higher education writers; they all seem to focus on an ideal college experience that largely consists of the Ivy League, Baby Ivies, Ivy equivalents, or expensive liberal arts colleges. Everyone seems to do it; writers for The Atlantic, Forbes, The New York Times, and Inside Higher Ed., and The Chronicle are often biased by their own educational experiences when discussing all of higher education.


Back to the article. Dr. Dorfman’s article covers a lot of ground when it comes to how much college costs and he starts off with the beta topic of higher education, acceptance rates (alpha is cost). I have already written about acceptance rates and they tell you nothing about what type of learning occurs at an institution. Dr. Dorfman relates acceptance rates to supply and demand and that tuition at those schools are fairly priced and could even be higher. I agree!


If Williams wanted to charge $93k a year, Claremont McKenna $90k a year, Harvard $84k a year, and Princeton $80k a year for undergraduates (double current tuition), go for it! the reality is that the students who want to go to these schools will pay for it, aid will cover it, or they will figure out a way to come up with the money. I think it is a good idea because places like this will truly become the haute couture of higher education, they can continue to act like only the best and brightest attend, and their exclusivity will be solidified.


I also agree with Dr. Dorfman that supply and demand needs to be better applied to higher education; all institutions in higher education need to be grounded in solid business practices while following economic principles that the private sector follows. Colleges and universities cannot constantly grow and the growth that many experienced during the 80s and late 90s is gone. Programs and departments need to follow supply and demand (for the most part) and need to have funding not only for the short-term but also long-term.


Next Dr. Dorfman goes after federal loans as a contributor to to skewed college pricing. I agree that aspects of financial aid and federal loans have had a major unintended consequence when it comes to higher education (besides fraud). As Dr. Dorfman stated, “either way, more federal aid ends up bringing colleges more money rather than yielding savings for students and their families.”


In my view, the federal aid problem is health care light. When my wife and I had our son we had no idea how much it would cost because our hospital could not tell us; they had to submit the bill and then insurance would pay part of it with us left to cover the rest. This is bunk. You cannot shop around because no one can give you a straight answer. Higher education is similar to health care but not nearly as bad but that does not mean that it is good. Serious reform needs to occur because college pricing is bunk.


Finally my favorite quotes from Dr. Dorfman’s article.


“Students who expect to pursue careers that are not high paying would likely be better served by attending lower-priced public colleges. Students who would need to incur large student loans to attend a private college should carefully consider public education options.”


I agree; solid advice.


“Critics, just like students, need to remember that the public option is out there.”


This is my favorite quote from Dr. Dorfman’s article. To me this implies his circle of peers all went to the Ivy League or Ivy equivalents. For the majority of students out there, and I mean the vast majority of the millions of students out there, “the public option” is the only option. By having a statement like this shows a disconnect with the typical American family that wants their children to go to college but not have $50k in debt afterwards.


American families struggle to pay/help their kids with college because:
1. Median household income is $53.3k;
2. They still have to save for retirement;
3. They have to pay down other debts (own college loans, mortgage, et cetera.);
4. Multiple children.


All families want to help their children within reason but a median household income can only go so far. ‘Critics’ and writers who write about higher education are the ones that need to remember the public option.


As long as affordable options are out there, why should we be concerned if there are also expensive choices? Nobody thinks that cars are unaffordable because Mercedes has a model that costs $100,000. College is not unaffordable because Harvard, Stanford, and other top schools are expensive. Students have plenty of other college options. Just as not everybody can buy a Mercedes, students should choose a college that they both love and can afford.”


I agree; who cares about Harvard, Stanford, and the like. Let the rich and the super motivated go to those schools and become titans of their fiefdoms while the majority of students go to those other schools, including community colleges that higher education writers seem to brush over constantly.

Sunday, May 25, 2014

Mocking Sculpture

Recently a sculpture by George Rammell at Capilano University was seized by administration because the sculpture, not so glamorously, depicted the university president and her poodle. This action started a lively discussion about artistic freedom, censorship, and the actions of administration towards faculty.


Now I live in Arizona, over 2,500 km away and if Capilano’s administration would have done nothing about this sculpture I, and probably most people south of the border and east of Vancouver would not know about it but since they seized it everyone knows! There are so many things wrong with this situation it is hard to know where to start.


First; administration. I understand why administration were not fans of this sculpture. According to the President of the Board of Directors, Capilano University (along with every other organization) strives to “to cultivate and protect a respectful workplace in which personal harassment and bullying are prohibited” while this sculpture, according to the President of the Board, “has been used in a manner amounting to workplace harassment of an individual employee, intended to belittle and humiliate the president.”


I assume that all employees of Capilano along with faculty and the president have to acknowledge an employee handbook and in this handbook it states that employees cannot harass each other. At the end of the article Steven Dubin, a professor of arts administration at Columbia was quoted about this situation.
“‘It sounds like it was handled as badly as it could possibly have been handled. I think they lost all credibility when they levied workplace harassment. That’s absurd,’ Dubin said, noting that harassment usually implies a power differential in which the harassed is the comparatively powerless figure.”
I agree that this situation was handled about as badly as it could have been handled but to say that this is not harassment is interesting. Harassment occurs at every level; top to bottom, amongst equals, and bottom to top, and to disregard this as possible harassment means that you have a limited, only top to bottom view of harassment.
“People who are in the public as the university president is and who make decisions that affect a lot of people need to have a thicker skin and there needs to be a higher level of tolerance for satire and caricature and so on."


Again, I agree  with Dubin that people who are in the public sphere have to have a thick skin but does a university president, of a mid-sized university, need to have a tolerance for satire and caricature? Is it common for faculty members to make fun of their boss in a very public manner? Is it okay for a rank a file employee to publicly make fun of the president of their company? Is it okay for a lieutenant to publicly make fun of the general of the army? Or is it because this is academia that people seem to think that faculty members, aka. employees can be blatantly disrespectful in the name of artistic and academic freedom? (FYI, I have a hard time figuring out how this falls under academic freedom; artistic licence, yes, but with artistic licence comes possible consequences.)


Also, does Steven Dubin have any expertise on the topic of workplace harassment being a professor of arts administration or is it because he is from Columbia that his thoughts carry more weight? I would rather read the opinion of a third party Canadian HR expert than just some professor in arts administration.


Next; the artist. Are the crimes committed by the president of Capilano University so heinous that she merits a mocking sculpture? You can’t choose another subject to mock; Stephen Harper, Barack Obama, Vladimir Putin, Bashar al-Assad or something light to mock like a shuttlecock, American Football, McDonald’s, or Barbie?


With that said I understand why George Rammell is upset. In 2013 Capilano University was facing a budget shortfall and one of the ‘line item’ cuts was the Studio Art Diploma of which he is a faculty member. Does this merit him creating a sculpture that blatantly makes fun of the president? Does it give him the right to publicly disrespect the president of the institution?


The problem with budget cuts is we (usually) do not know steps that led to the actual cuts. Did the arts faculty, including Mr. Rammell attend the budgetary meetings and plead their case for the Studio Arts Diploma? Were they or their faculty representatives part of the governance process or did the administration just make cuts without thought, consultation, or public discussion?


Finally; come on! Get it together people and talk it over. Administration at Capilano University need to talk to its faculty and get their input; faculty need to talk to administration and be part of the governance process including the boring budget meetings. In my mind this is not an us versus them issue, this is bad communication on every level and every side of the equation issue.


Addendum:
At the end of the day this article was longer than I originally intended because the situation is such a mess! What could have been done to make this situation better? Below are three ideas:
- Capilano University should never have seized the sculpture without due process; they should give it back to Mr. Rammell;
- If administration believes harassment occurred, Mr. Rammell needs to be ‘charged’ and be on disciplinary review;
- If administration did not want the sculpture on-campus they should have informed Mr. Rammell of this fact allowing him time to remove it.


If Capilano would have just started with the third bullet point then there still might be a controversy, but it would be much smaller. If Capilano's administration would have informed Mr. Rammell that the sculpture was creating an issue on-campus, <Enter Policy Here> and that he had xx-days to remove it then he would have been fully informed. He could have appealed, allowing for due process or if he refused then the university could remove the sculpture and be within their ‘right’. Or, after informing Mr. Rammell of the need to remove the sculpture he could have moved it to a studio where it could have lived in full glory for the world to view.

But did these events occur? It does not seem like it and so we have an asinine controversy and broken trust because of poor communication, lack of respect, and no desire to follow due process.

Friday, May 9, 2014

Guest Author: The Role of Liberal Arts in a College-and-Career-Ready Society by anonymouscharity

Ask a stereotypical barista a stereotypical question: “What did you study in college?” You might just get a stereotypical answer: sociology, English, history, or anthropology. There is derision of liberal arts study floating around the media and society at large (see: here or here for examples). There are also counter-arguments, extolling the benefits of the liberal arts.

I recently read an article that distinguished “liberal arts education” from “liberalist education” as a possible explanation for why the value of studies in humanities is questioned by so many. In it, Nathan Schlueter described a dichotomy. On the one hand are the liberal arts, which he asserts promote study of “truth, beauty, and goodness” through exploration of Great Books, study of great scholars and writers of the past, and helping students examine current issues in light of that search for wisdom. On the other hand are “liberalist” studies, which he says have three features: “First, a suspicion of all authority, including the authority of truth; second, the celebration of autonomy and individual choice; third, a commitment to social justice.”

Schlueter explores this so thoroughly, I won’t repeat his discussion here. But for me, the issue of the value of liberal arts raises the question: what is the role of liberal arts general education in an educational program that is focused on careers? In my professional role, I support information technology degree and certificate programs at a for-profit institution. Students in my programs are seeking career-ready skills in networking, information security, web design, and a host of other technical skills.

Some students opt for certificate programs, which solely focus on the technical coursework. But students in the associate’s and bachelor’s degree programs also complete general education coursework, to the tune of 42-45 credits. They take required and elective courses in the humanities and sciences, with the institution’s goals of developing critical thinking, communication, information utilization, and collaboration.

I wonder: is it enough that they develop those skills, which could translate to any professional setting to support their career outcomes? Or should students also gain those insights that Schlueter listed, through study of “truth, beauty, and goodness?” How focused on liberal arts should the curricula of humanities coursework be, in the context of a career-oriented degree program?

If planned effectively, study of the liberal arts could help these technically-minded students enhance their appreciation of elegant technical solutions to organizational problems. The liberal arts may provide IT professionals a common language of culture through which they could develop more meaningful relationships with coworkers who are not in IT. Study of the liberal arts might even awaken a deeper interest in the arts, sparking hobbies outside of their professional life and enhancing the creativity these professionals apply to technical designs.


What are your thoughts? What is the role of humanities coursework for an IT degree (or any career-focused program)?


anonymouscharity works at a for-profit higher education institution in the Phoenix metro area. 

Saturday, May 3, 2014

Value and Salary

There has been quite the reaction to Paul Krugman’s appointment to the City University of New York! The reactions range from those who say he deserves his $225,000 salary, those who say it is a joke and an insult, and those who shrug their shoulders. As the article progresses we will see which camp I am in.

City University of New York (CUNY) obviously wants Paul Krugman and needed to pay a pretty price to lure him away from Princeton; academic superstars cost money. It is up to the President and the Board of Directors of CUNY to pay him a salary that is allowed within their budgetary constraints of a state institution. Once the President and Board of Directors agree on a salary the decision is on them along with all the positive and negative press (I am sure legal has some part in this but we never know about those conversations).

In an article at Inside Higher Ed. that is not positive or negative about Krugman’s appointment, one interesting comment was “Indeed, the amount offered to Krugman was quite generous as it exceeds that of any other distinguished professor at the Graduate Center by at least $5,000, and in many cases upwards of $75,000.”

So he will be getting paid between 2% to 33% more than other distinguished professors...seems logical. Not everyone gets paid the same amount especially when you are talking about academic superstars; are there other distinguished professors who are as ‘distinguished’ as Paul Krungman? Probably. When I went through the list of Distinguished Professors I only recognized a small handful; Richard Alba, Talal Asad, and John Corigliano who is a huge superstar in the music world.

Having the title Distinguished Professor or even being an academic superstar does not always equal a big fat paycheck. As with many things in life how much you get paid depends on many factors that are often out of your control; how the overall economy is performing, budgetary constraints, staffing, how big of an academic superstar are you, content, et cetera. Some people get paid more because of longevity, some get paid more because of merit, and some get paid more because of luck. But if you are a professor getting paid between $150k to $220k a year that is not a bad gig and if you need more money, write a book that will sell!

There is also the discussion about Paul Krugman's research about income inequality. I have not exhaustively read his writings but from what I understand Paul Krugman writes about the super-rich, not just the kinda rich on the low-end of rich. Krugman is not worth several bi$$ion or a few hundreds of  mi$$ions, he is worth $2.5 million which is a huge accomplishment for an academic and writer; kudos to him! It is not like he is David Beckham who after a long career at Manchester United, Real Madrid, and Los Angeles, along with a hefty modeling career, is worth $300 million or J.K. Rowling who is worth a cool $1 billion.

For me, hiring Paul Krugman, along with all of the wonderful talent City University of New York already has, shows the academic world that CUNY is a force to recon with. With that said, because CUNY includes City College, Hunter College, Baruch College, Lehman College, CUNY Graduate Center, and many other colleges rankings get confusing. If you include the seven community colleges in the CUNY portfolio you have a huge system that educates hundreds of thousands of students, provides real value to the city and state of New York but does not offer exclusivity. This exclusivity unfortunately helps rankings and the perception of quality and if you look at rankings (which do not matter but many people pay attention to them) the colleges of CUNY all fall somewhere in the middle; not high and not low.

Da Capo. For me, I don’t care that Paul Krugman is going to get paid $225k a year at CUNY; the President and Board of Directors approved the salary and he is a huge win for the Graduate Center. What is important for me is that all of the colleges of CUNY continue to provide excellent education to hundreds of thousands of students in New York at a reasonable price and if they have some academic superstars as part of their very large New York portfolio, good for them!